Data Visualization gives you more clarity in decision making and is an important part of the digital transformation journey. Knowing that your business is aligned to meet customer demands and is resilient in the fast-moving digital marketplace means peace of mind. Being able to digitally visualize your data in simple, relevant and accurate reports and dashboards is key to gaining the business intelligence you need.
 Move from Silos to a Single Source of Data
Business data lives in data silos that don't connect. Merging critical data from each Source of Record provides a single database for analytics while keeping each source intact. Reports and dashboards generated from this source will provide understandable and accurate information. Decisions can be made with confidence.
Eliminate Data Redundancies.
Get the Whole Picture with Real Time Data
BIAdvantage, our SaaS solution, is the hub for your combined data. It not only stores the combined data pulled from your systems, but because its always on, it continues to cultivate that data to always provide the most current and accurate data at the point when you need it. Get historical statistics, snapshot and trend analysis, and enterprise reporting wherever and whenever you need it.
Trust Your Data.
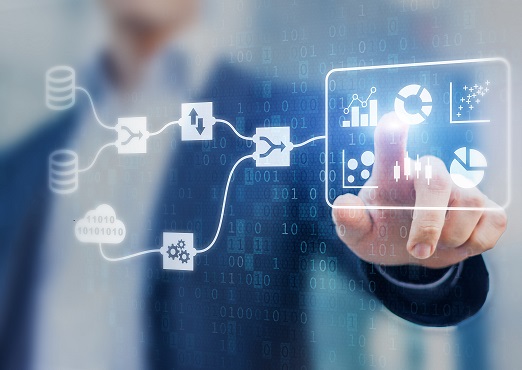
Integrate business systems to drive digital transformation in your business

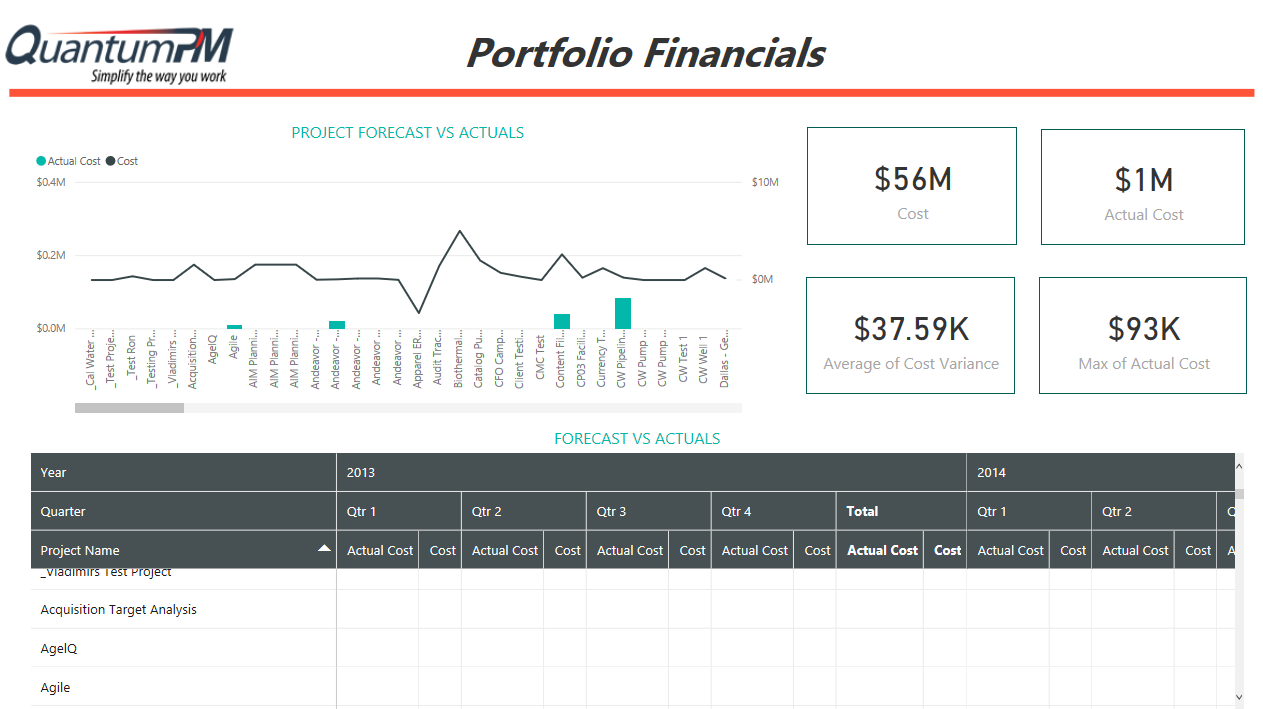
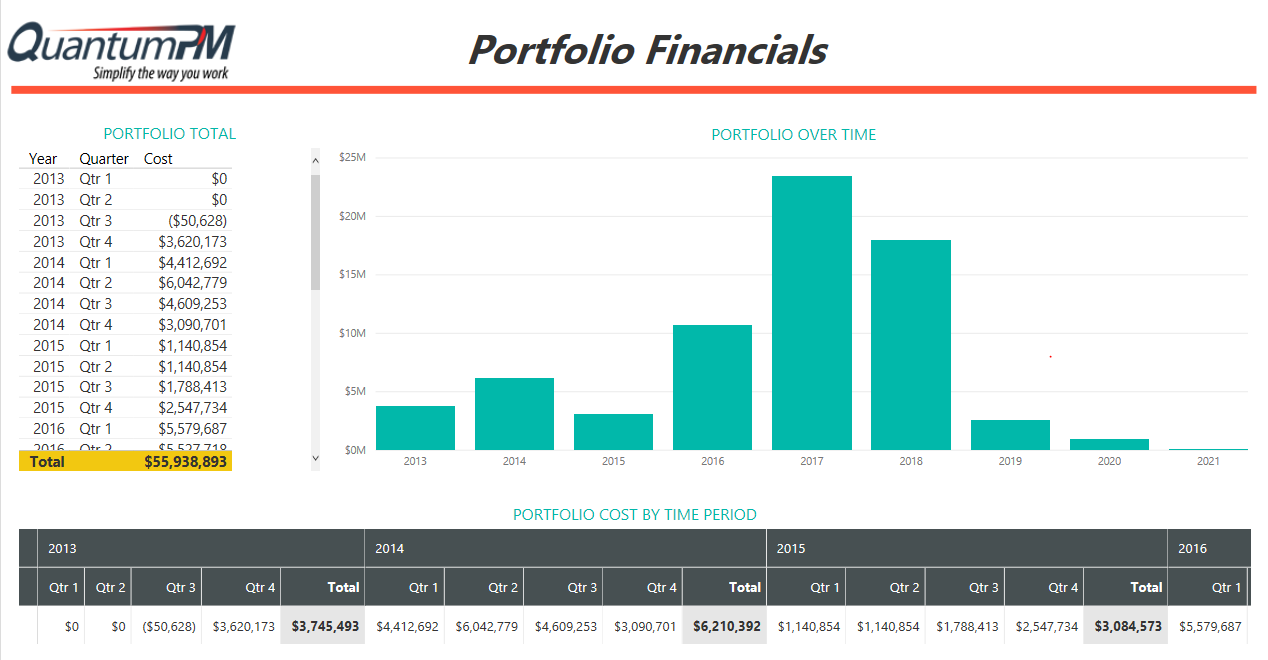
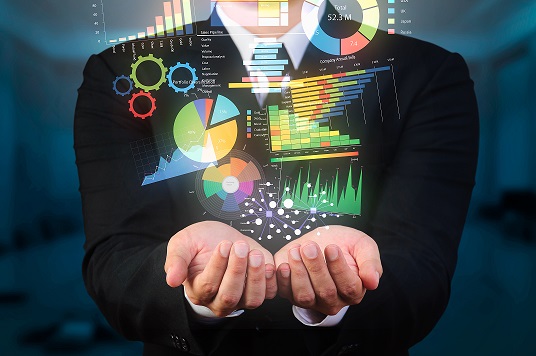 Data Visualization brings clarity to your data
Seeing your data in a graphical format, makes it more understandable. Clear reports and dashboards make identifying emerging trends and issues easier so you can take action with confidence. Trusted data stored in BIAdvantage can be connected to any reporting engine to give you accurate and timely reports. And reports can be automated, customized and generated from any reporting engine.
See. Understand. Take Action.
________________________________________________________________________________________________________________________________________________